

Built around a visual
Each question is anchored to a graph, table or image, so students reach the answer by reading the visual.
Enter a topic and grade level to get standards-aligned visual questions as a PDF with an answer key.
The diagram shows the structure of a metal. The atoms have lost their outer shell electrons, and these electrons move freely through the whole structure.
Which description best explains the bonding in a metal?
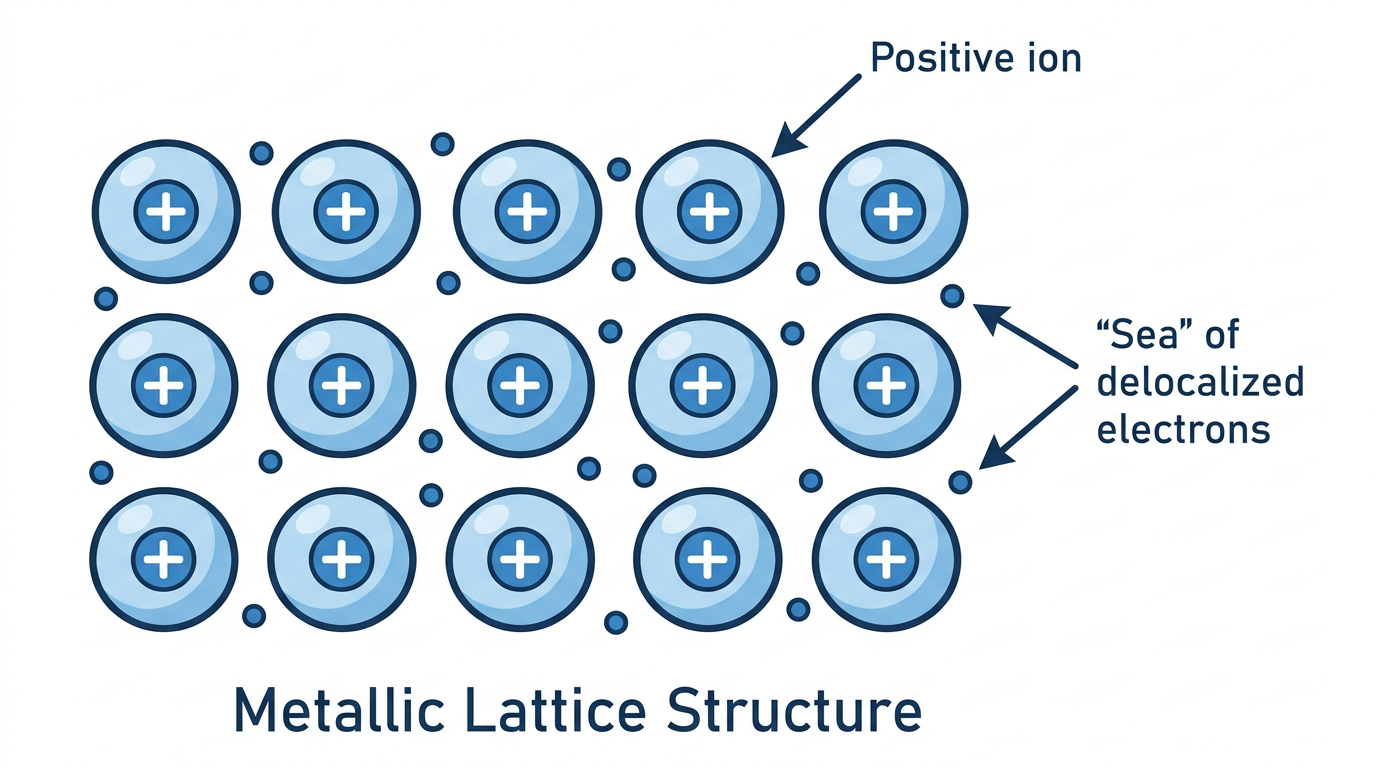
Solution: Metallic bonding consists of a giant lattice of positive metal ions. These ions are surrounded by a sea of delocalised electrons that are free to move. The strong electrostatic attraction between these positive ions and the delocalised electrons holds the structure together. Covalent bonds involve sharing electron pairs, while ionic bonds involve the transfer of electrons between atoms. A mixture contains different substances that are not chemically bonded.
Different substances conduct electricity in different ways. Some materials conduct electricity because they contain charged particles that are free to move. The diagram shows the structure of a metal.
Why are solid metals good conductors of electricity?
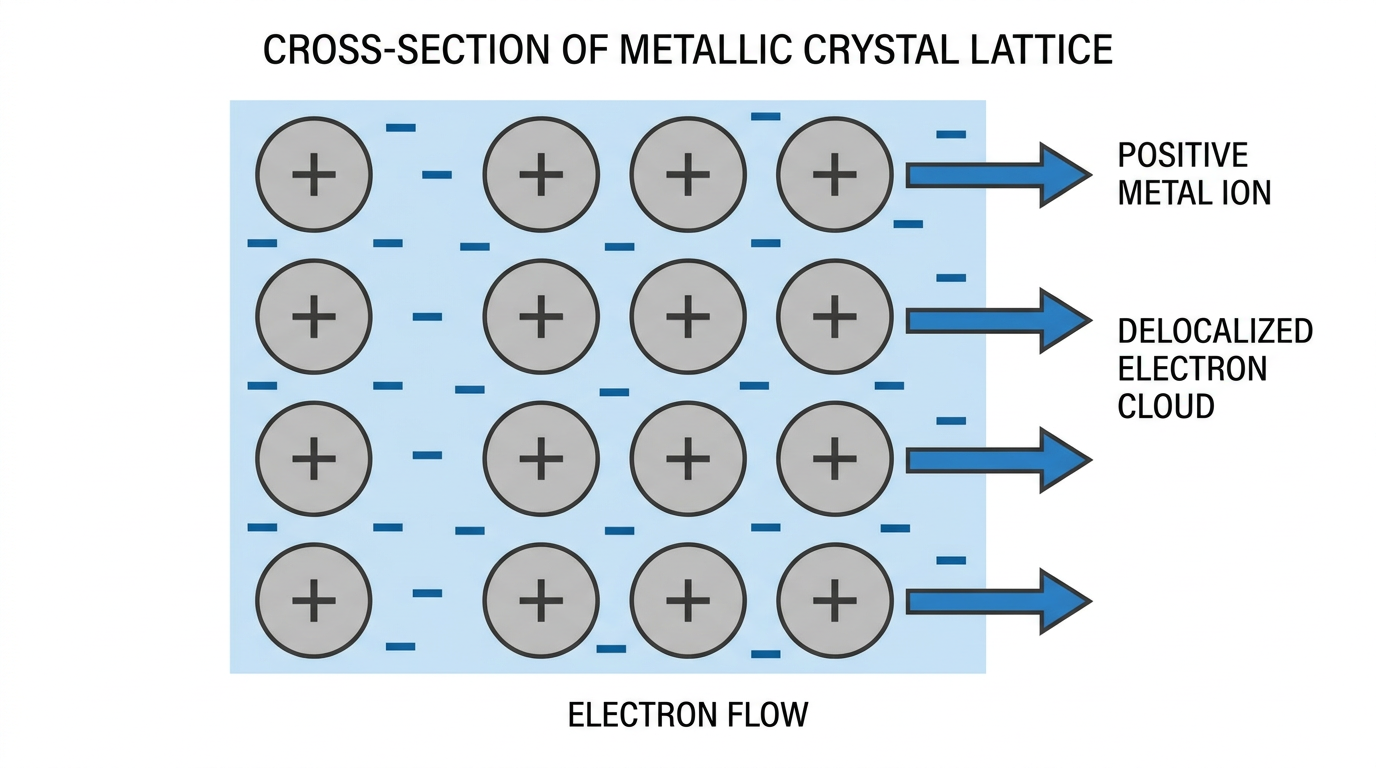
Solution: Metals are good conductors of electricity because the delocalised electrons are free to move through the giant metallic lattice when a voltage is applied. In contrast, simple molecular compounds like water or methane have no free electrons or ions to carry a charge, making them poor conductors. Ionic compounds only conduct when molten or aqueous because the ions are then free to move, but not in the solid state. Graphite is a non-metal that conducts, but most non-metals do not.
Metals can be hammered into thin sheets or drawn into wires. The diagram shows what happens to the layers in a metal when a force is applied.
What allows a metal to be malleable and change shape without breaking?
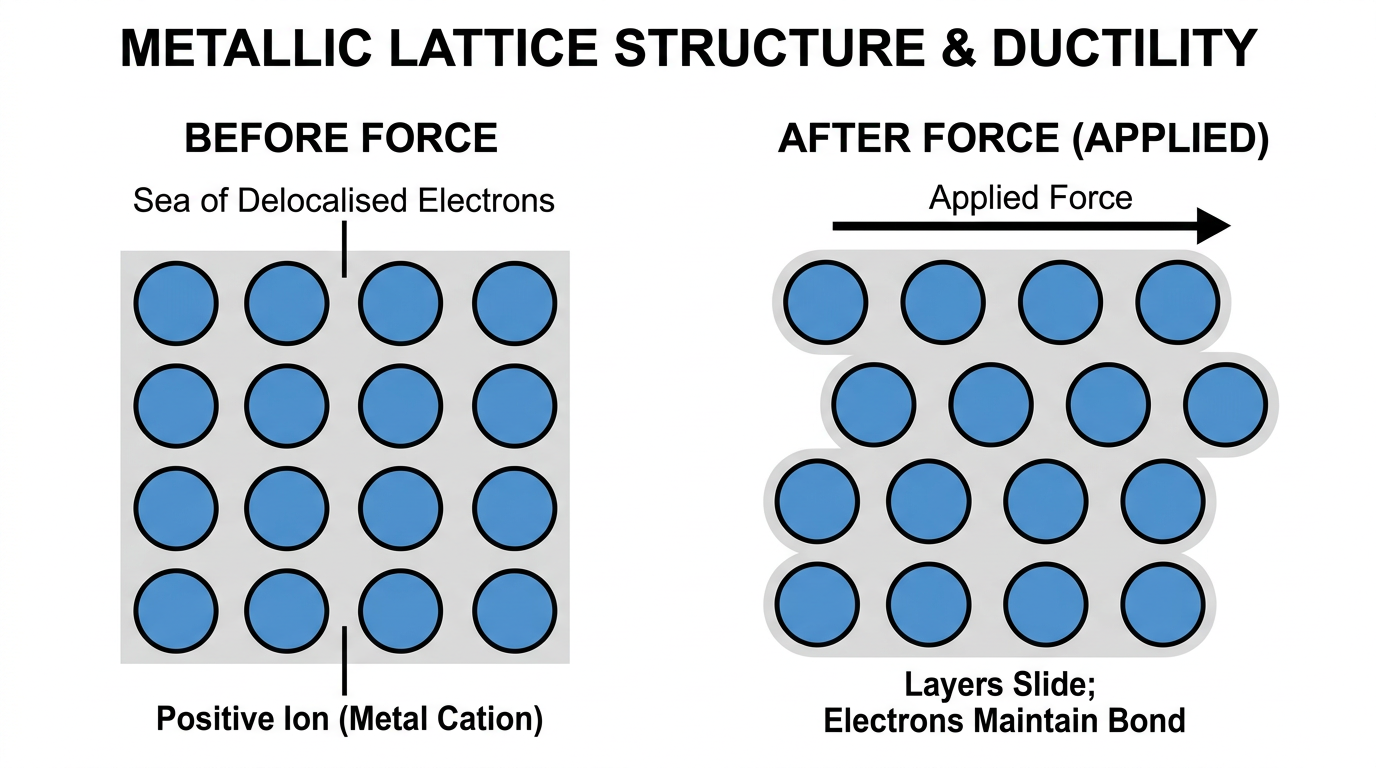
Solution: Metallic lattices are malleable and ductile. This is because the layers of positive ions can slide over each other when a force is applied. The sea of delocalised electrons moves with the ions, so the metallic bond is not broken. In giant covalent structures like diamond, the bonds are rigid and break if the atoms move, making them brittle. Compounds and mixtures have different physical properties based on their specific compositions.
The periodic table organises elements based on their atomic structure. The proton number determines the identity of the atom. The number of shells and outer electrons determine an element's position in periods and groups. The diagram shows a sodium atom. Give the electronic structure of sodium. Use it to explain the position of sodium in the periodic table (period and group).
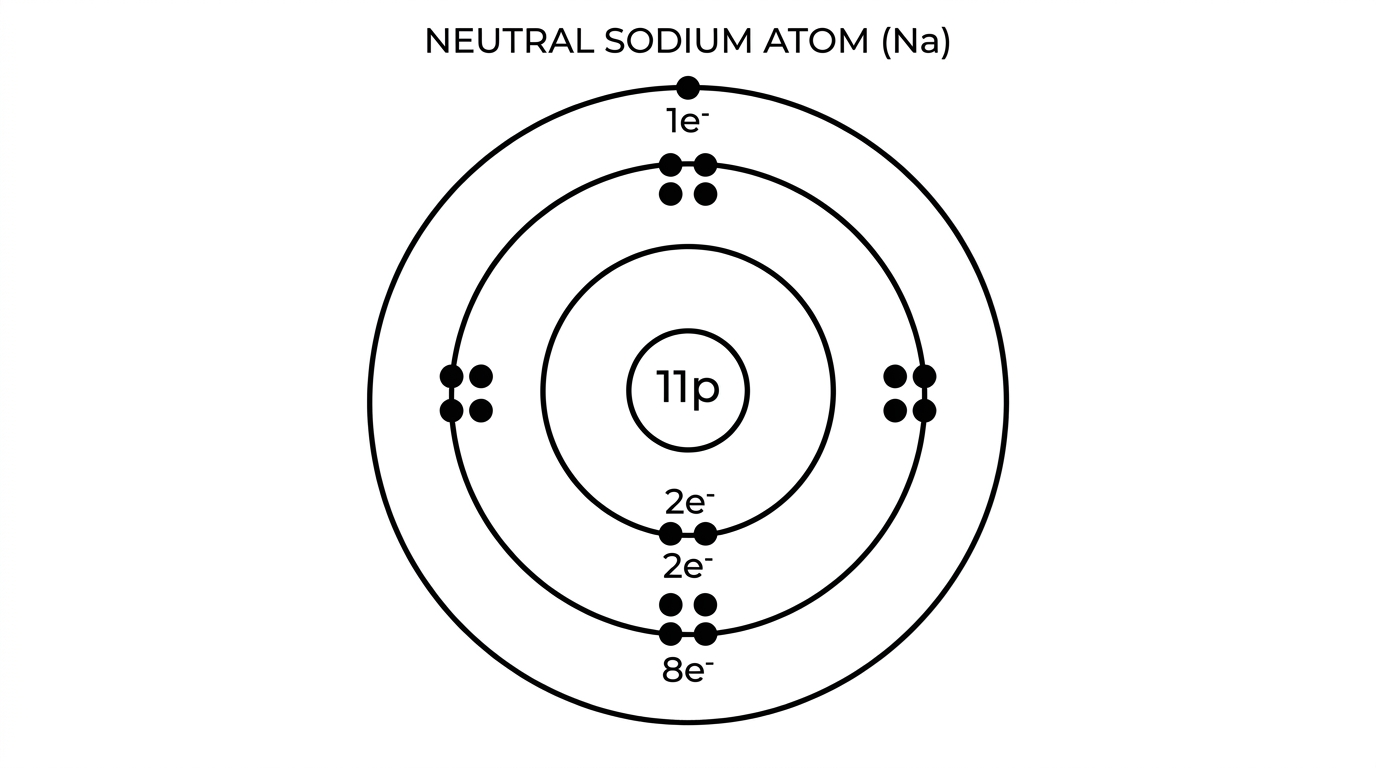
Sample answer: A sodium atom has a proton number of 11. It has 11 electrons. The electronic configuration is 2,8,1. It has three occupied electron shells, so it is in Period 3. It has one electron in its outer shell, so it is in Group I.
Marking criteria:
The diagram shows two atoms of carbon with different masses. State what is meant by the term isotope. Explain why different isotopes of the same element have the same chemical properties.
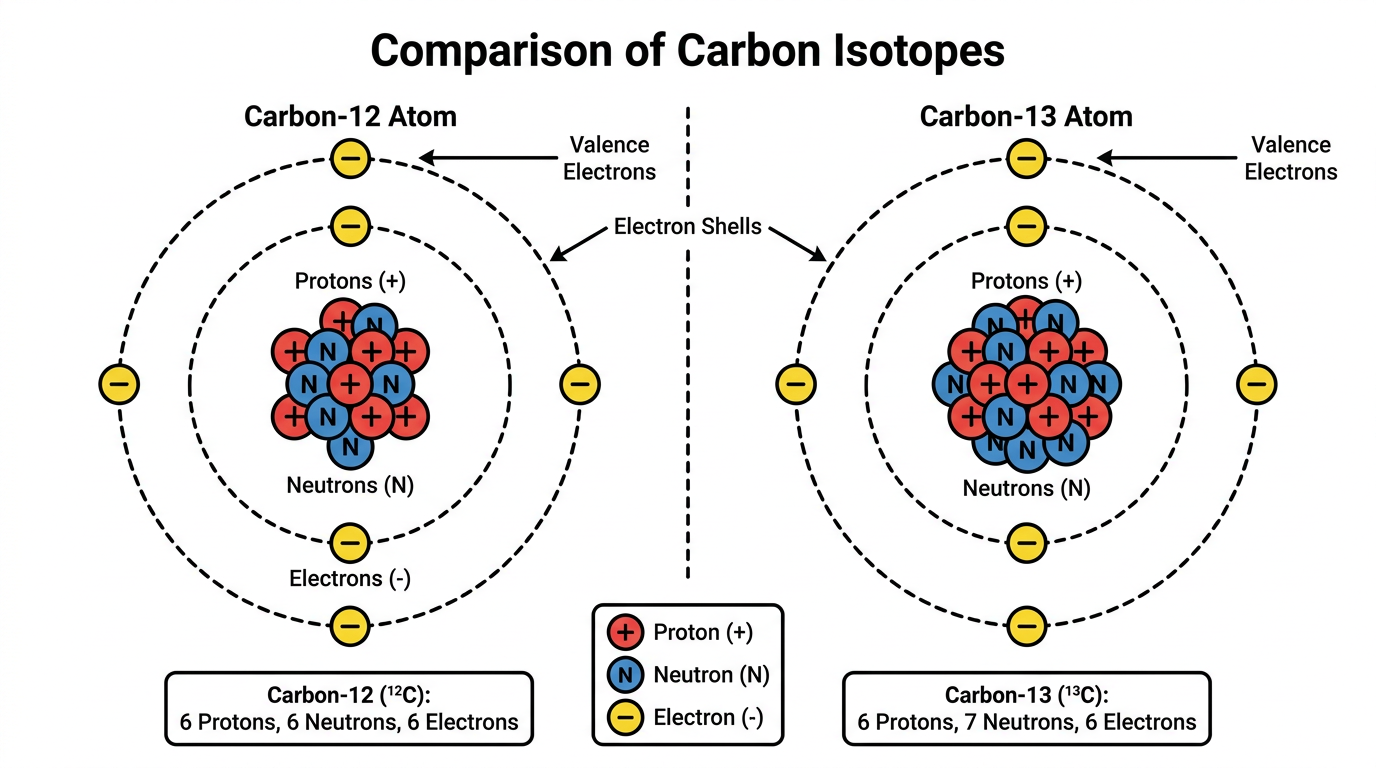
Sample answer: Isotopes are atoms of the same element. They have the same number of protons but different numbers of neutrons. Isotopes of the same element have the same chemical properties. This is because they have the same number of electrons and the same electronic configuration.
Marking criteria:
Ionic compounds like sodium chloride form when different types of elements react. As depicted in the figure, these substances have a regular arrangement of ions called a giant lattice. Their bonding affects their physical state and properties. Based on the chemical processes shown in the image, describe how an ionic bond is formed between a metal and a non-metal and explain why ionic compounds usually have high melting points.
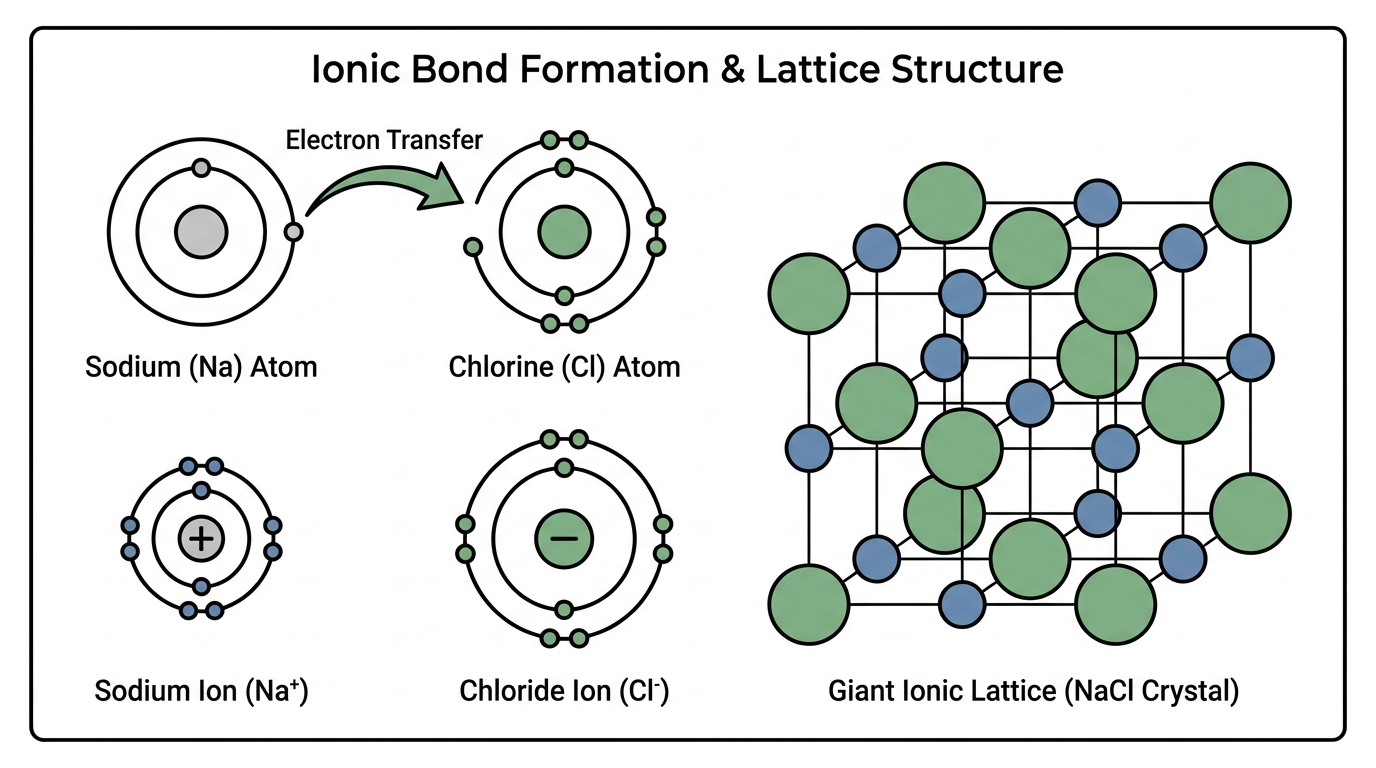
Sample answer: Ionic bonds form when a metal atom gives electrons to a non-metal atom. This creates positive ions and negative ions. An ionic bond is a strong attraction between these oppositely charged ions. These compounds have high melting points because the attractions in the giant lattice are very strong and need a lot of energy to break.
Marking criteria:
A baker uses 250 g of flour to make a batch of 6 muffins. The baker wants to make 18 muffins using the same recipe.
Calculate the mass of flour, in grams, needed to make 18 muffins. Show your working.
Sample answer: 750 g (or 750)
Marking criteria:
A pack of 6 identical drawing pencils costs £1.80.
Work out the total cost of 10 of these drawing pencils. Show your method.
Sample answer: £3.00
Marking criteria:
Liam and Maya share 45 counters in the ratio 2 : 3. Calculate how many counters Maya receives.
Sample answer: 27
Marking criteria:
Look at the diagram of the running track and percentage bar model. Calculate the distance the athlete runs during the warm-up.
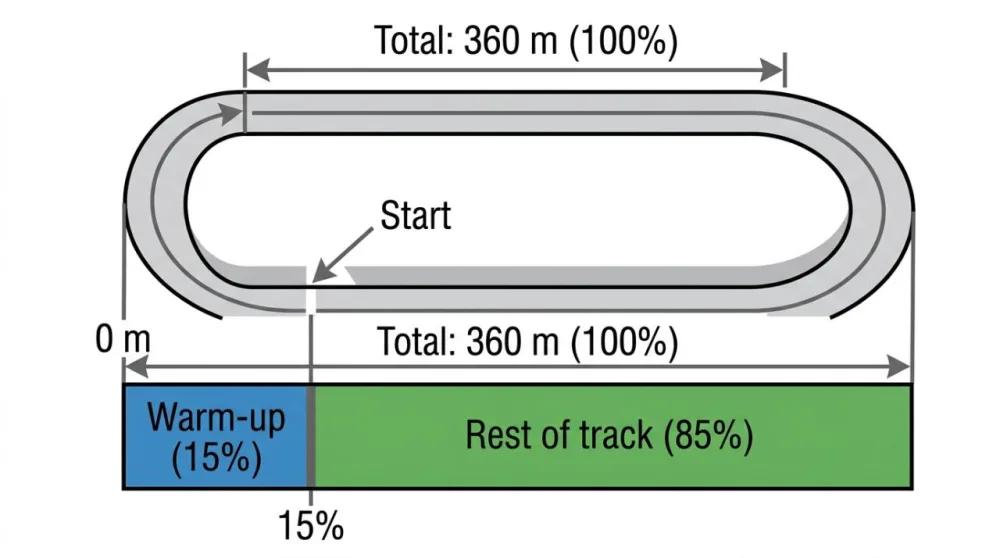
Solution: To find 15% of 360 m, first find 10% by dividing 360 by 10, which gives 36 m. Then find 5% by halving 36 m, which gives 18 m. Adding 10% and 5% together (36 m + 18 m) gives 54 m. 18 m is only 5%, 36 m is only 10%, and 72 m is 20%.
Look at the bar model representing the school library books and calculate the number of borrowed books.
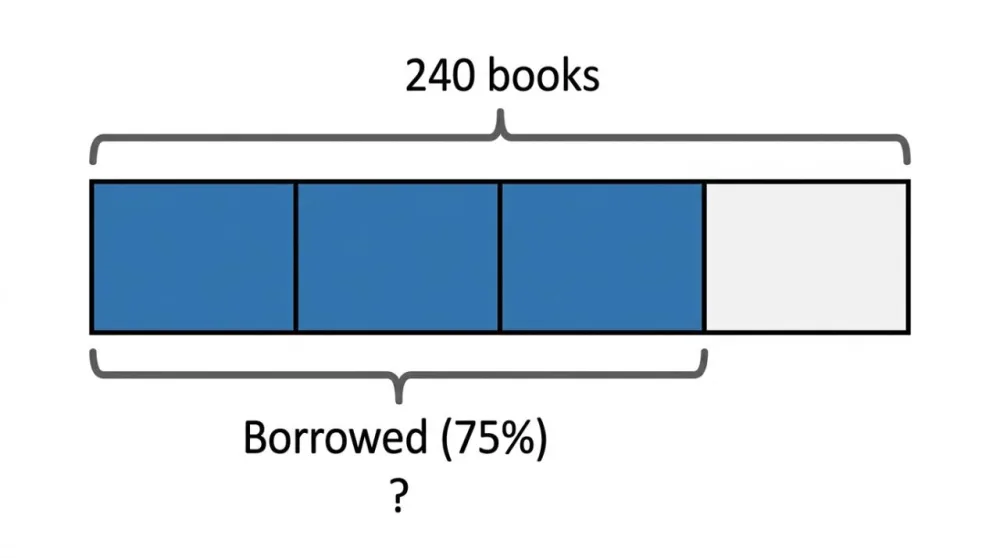
Solution: To find 75% of 240, convert 75% to the fraction 3/4. First find 1/4 of 240 by dividing 240 by 4, which gives 60. Then multiply by 3 to find 3/4: 60 × 3 = 180. Therefore, 180 books were borrowed. The value 60 is only 25% (stopping after finding 1/4), 120 is 50% (half of 240), and 160 is 2/3 of 240.
A photograph is enlarged to create a poster as shown in the diagram. What is the perimeter of the enlarged poster?
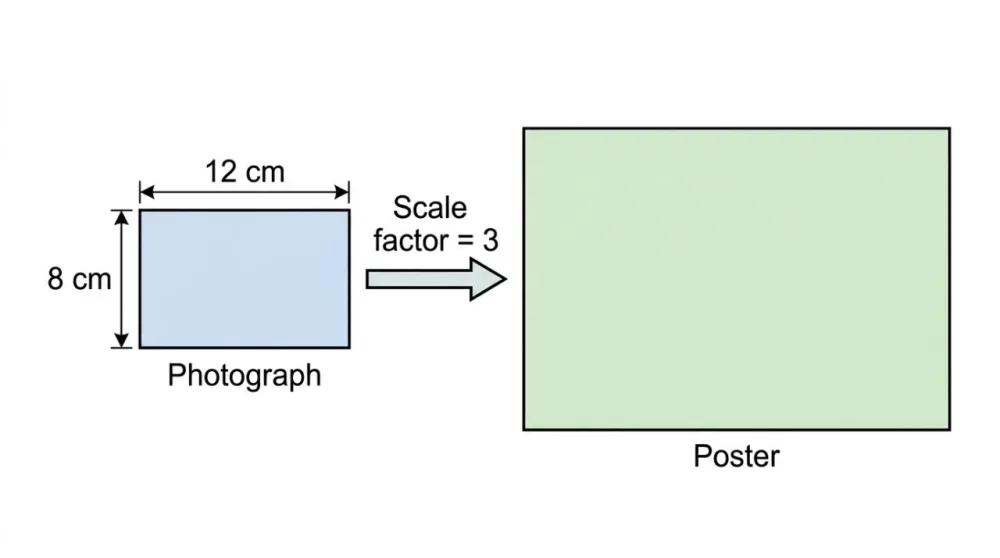
Solution: First, calculate the dimensions of the enlarged poster by multiplying each side length by the scale factor of 3: width = 8 cm × 3 = 24 cm, and length = 12 cm × 3 = 36 cm. Then find the perimeter: 2 × (24 cm + 36 cm) = 2 × 60 cm = 120 cm. Alternatively, find the original perimeter first, 2 × (8 cm + 12 cm) = 40 cm, and multiply by the scale factor: 40 cm × 3 = 120 cm. 40 cm is the original perimeter without enlargement. 60 cm is the semi-perimeter (width + length) of the enlarged poster. 288 cm is the area of the enlarged poster divided by 3, or confusing area and perimeter calculations.
A rectangle with a length of 6 cm and a width of 4 cm is enlarged by a scale factor of 3. The perimeter of the enlarged rectangle is 60 cm.
Solution: To find the dimensions of the enlarged rectangle, multiply each side length by the scale factor of 3: the new length is 6 cm × 3 = 18 cm, and the new width is 4 cm × 3 = 12 cm. The perimeter of the enlarged rectangle is 2 × (18 cm + 12 cm) = 2 × 30 cm = 60 cm. Alternatively, the original perimeter is 2 × (6 cm + 4 cm) = 20 cm, and multiplying the original perimeter by the scale factor of 3 also gives 20 cm × 3 = 60 cm. Therefore, the statement is True.
A baker uses 3/5 of a bag of flour on Monday and 3/10 of the original bag of flour on Tuesday. True or false: the baker has used more than 4/5 of the bag of flour in total.
Solution: To find the total fraction of the bag used, add 3/5 and 3/10. Convert 3/5 to tenths: 3/5 = 6/10. Adding the amounts gives 6/10 + 3/10 = 9/10. To compare 9/10 with 4/5, convert 4/5 to tenths: 4/5 = 8/10. Since 9/10 is greater than 8/10, the statement is true.
A jacket originally priced at £80 is reduced by 35% in a sale. The price of the jacket after the discount is £________.
Answer: 52
Solution: To find the sale price, first calculate 35% of £80. 10% of £80 is £8, so 30% is 3 × £8 = £24. 5% of £80 is half of £8, which is £4. Therefore, the 35% discount is £24 + £4 = £28. Subtracting the discount from the original price gives £80 - £28 = £52. Entering 52 completes the statement correctly.
A piece of ribbon measuring 72 cm in length is cut into two pieces in the ratio 3 : 5. The length of the shorter piece is ________ cm.
Answer: 27
Solution: The ratio 3 : 5 gives a total of 3 + 5 = 8 equal parts. The length of one part is 72 ÷ 8 = 9 cm. The shorter piece has 3 parts, so its length is 3 × 9 = 27 cm.
Each question is anchored to a graph, table or image, so students reach the answer by reading the visual.
Questions follow your curriculum standards, and every one comes with a short explanation of the correct answer.
Download the questions with an answer key and use them in a test, a worksheet or a review lesson.
In Madlen a set of visual questions is ready in three steps.
Enter the topic and the grade level for your questions.
Madlen builds curriculum-aligned questions around graphs, tables and images, so students reach the answer by reading the visual.
Download the questions as a PDF with the answer key and a short explanation for each one. You can also share them with students.
In Madlen’s Visual Question Generator you enter a topic and a grade level. The AI designs questions built around graphs, tables and images in seconds. You can download them as a PDF with an answer key.
A visual question generator creates questions that students answer by reading a graph, table or image. Madlen’s Visual Question Generator builds these questions with AI and aligns them with curriculum standards. It is one of more than 50 tools in the Madlen Toolbox.
You choose the topic and grade level in Madlen, so the Visual Question Generator is not tied to one subject. One of our samples is a Grade 9 Chemistry set on metallic bonding with diagrams.
Yes, Madlen exports visual questions as a PDF with an answer key. Each question also includes a short explanation of why the correct answer is right.
Madlen has a free plan, so teachers can sign up and start creating without paying. Madlen is already used on more than 150 campuses.
Create a free account and start with the tools you need today.